Businesses generate more data than ever before.
Orders, inventory movements, customer activity, sales transactions, warehouse operations, support requests, financial metrics, and application events are continuously being recorded across different systems.
But having data is not the same as having visibility.
A business may have millions of records stored across its ERP, CRM, databases, and operational systems and still struggle to answer a simple question:
“What is happening in the business right now?”
This is where real-time business dashboards become valuable.
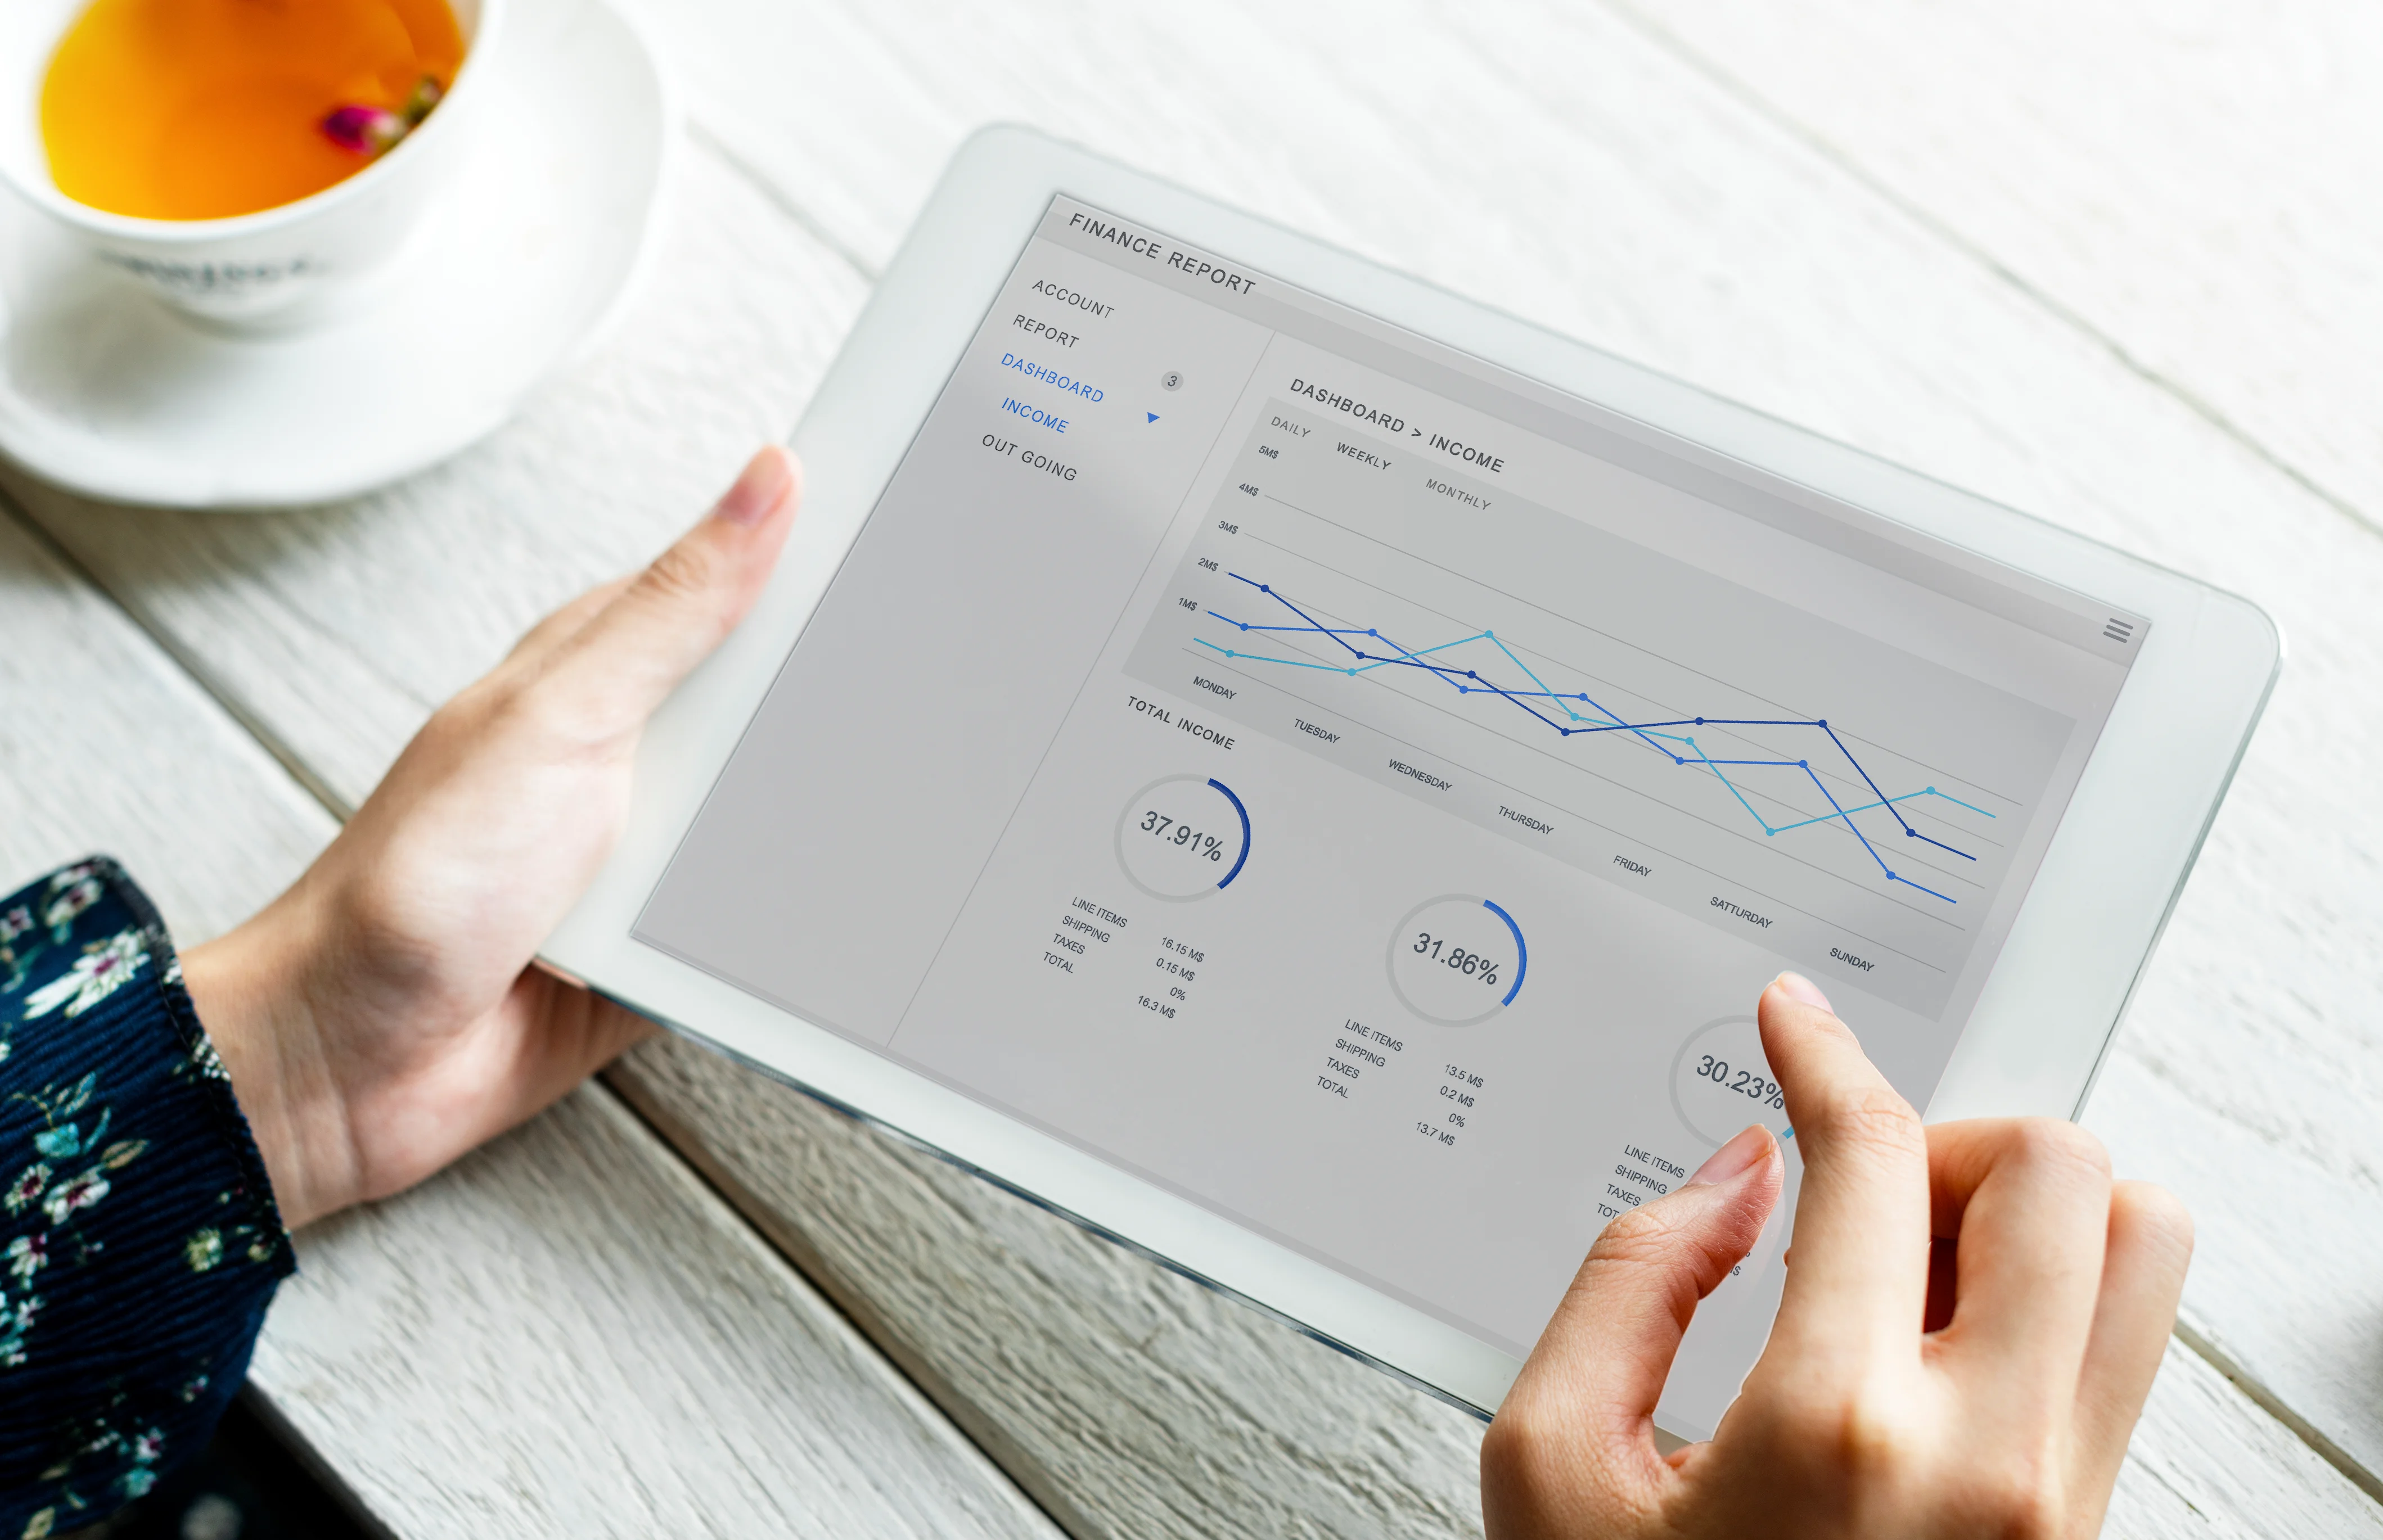
A well-designed dashboard transforms operational data into actionable information through KPIs, charts, alerts, trends, and interactive visualizations. Instead of waiting for manually generated reports, decision-makers can monitor business performance as events occur.
However, building a dashboard that looks good is relatively easy.
Building one that remains fast, secure, accurate, scalable, and responsive as data volumes grow is a much more significant engineering challenge.
This article explains the architecture, technologies, design principles, and engineering practices required to build scalable real-time business dashboards for modern enterprises.
A scalable real-time dashboard should not simply query a database every few seconds and refresh a screen.
That approach may work for a prototype, but it can quickly become expensive and unreliable at enterprise scale.
A production-grade dashboard needs a carefully designed architecture covering:
A common architecture for enterprise dashboards can look like this:

The exact implementation depends on the business requirements, data volume, latency expectations, and existing technology ecosystem.
The key principle is simple:
A dashboard should be engineered as a business application—not treated as a collection of charts.
The term “real-time” is frequently used loosely.
A dashboard displaying data that refreshes every 30 minutes is not truly real-time.
But real-time does not necessarily mean that every data point must appear on screen within milliseconds.
Different businesses have different latency requirements.
For example:
| Business Requirement | Appropriate Data Strategy |
|---|---|
| Financial monitoring | Near real-time |
| Warehouse operations | Seconds to minutes |
| Executive KPIs | Minutes may be sufficient |
| Stock availability | Near real-time |
| Historical analytics | Batch processing may be sufficient |
| Critical alerts | Event-driven / immediate |
Therefore, the first question should not be:
“How do we make everything real-time?”
It should be:
“Which information actually needs to be real-time?”
That distinction can significantly reduce infrastructure complexity and cost.
One of the most common dashboard development mistakes is starting with visualization.
Teams immediately discuss:
But visualization should come after understanding the business problem.
Before designing the interface, identify:
An operations manager needs different information from a CFO.
A warehouse supervisor may need:
An executive may need:
A dashboard should help users answer specific questions.
For example:
This determines the appropriate architecture.
A dashboard is successful when it improves a decision—not when it contains more charts.
Key Takeaway: Design the dashboard around decisions and workflows, not around visualization types.
A real-time dashboard is only as reliable as the data pipeline behind it.
Data may originate from multiple sources:

The integration layer is particularly important when the dashboard depends on external systems.
Rather than allowing the frontend to communicate directly with every data source, a backend service can act as a controlled abstraction layer.
This provides:
For modern enterprise applications, the dashboard frontend should generally communicate with backend APIs rather than directly querying databases or external systems.
A typical architecture might use:
Angular → ASP.NET Core API → Data/Integration Layer → Database/ERP
This separation provides several advantages.
Database credentials and integration credentials remain on the server.
Business logic remains centralized.
APIs can be independently optimized and scaled.
The same APIs can serve web applications, mobile applications, reporting systems, or other consumers.
Authentication, authorization, logging, validation, and rate limiting can be managed consistently.
Not every dashboard requires a permanent real-time connection.
There are several approaches.
The frontend periodically requests updated data.

This is simple and works well for dashboards where updates every few minutes are sufficient.
However, aggressive polling can create unnecessary traffic and database load.
The server can push updates to connected clients when information changes.
This can be useful for one-way server-to-browser updates.
For highly interactive real-time applications, persistent connections allow the server to push changes to clients immediately.
A typical architecture might look like:

This is particularly useful for:
Real-time communication should be introduced because the business requires it—not simply because the technology is available.
A well-designed polling architecture can outperform an unnecessarily complicated real-time architecture for many use cases.
When a dashboard becomes slow, the first instinct is often to add more server capacity.
That may not solve the actual problem.
Dashboard performance frequently depends on database design.
Common causes include:
For SQL Server-based applications, engineers should examine:
A query returning 50 records may still process millions of rows internally.
The solution is not always a larger server.
Sometimes the correct index or query optimization can provide a much larger performance improvement.
A dashboard should never retrieve thousands—or millions—of records simply because the frontend needs to display a small summary.
Instead, APIs should return only the information required by the current view.
For example, if the dashboard needs:
“Top 10 products by sales this week”
the backend should perform the aggregation and return the top ten results.
It should not send every transaction to Angular and ask the browser to calculate the result.
This principle becomes increasingly important as data volume grows.


The first approach reduces network traffic, browser processing, and frontend complexity.
Not every dashboard metric needs to be calculated from scratch every time someone opens the page.
Some information changes frequently.
Other information changes relatively rarely.
For example:
Caching can reduce unnecessary processing and database load.
A simplified architecture could look like:

The important question is not simply whether caching should be used.
It is:
What should be cached, for how long, and how should stale data be invalidated?
Poorly implemented caching can introduce stale or inconsistent information.
Even if the backend is fast, a dashboard can still become slow if the frontend attempts to render too much information.
Angular dashboards should be designed carefully when dealing with large datasets.
Useful techniques include:
Charts also need consideration.
Displaying thousands of individual data points may not provide more insight than displaying an intelligently aggregated trend.
More data does not necessarily mean more information.
A good dashboard reduces complexity.
It doesn’t move complexity from the database into the browser.
Enterprise dashboards depend on many components.

Any component can become temporarily unavailable.
What happens when the ERP API is down?
What happens when the database query times out?
What happens when a user’s real-time connection drops?
A production dashboard should degrade gracefully.
For example:
Users should understand the state of the information they’re viewing.
A dashboard showing yesterday’s data without telling the user is potentially more dangerous than a dashboard displaying an explicit error.
Business dashboards frequently expose sensitive operational information.
A user may have access to:
Security therefore cannot be added after the dashboard is finished.
A secure architecture should consider:
Who is the user?
What is the user allowed to see?
Can a regional manager see only their region?
Are endpoints protected against unauthorized access?
Are incoming requests properly validated?
Can sensitive actions be traced?
Are ERP and database credentials protected?
A visually impressive dashboard with weak authorization is not an enterprise solution.
A common architectural mistake is forcing one database to serve every purpose.
Operational systems are designed to run the business.
Analytical systems are designed to analyze the business.
Those workloads can be very different.
For example:

For smaller systems, a well-optimized SQL Server database may be sufficient.
As data volumes and analytical requirements grow, organizations may benefit from dedicated reporting databases, data warehouses, or analytical platforms.
The architecture should evolve with the business.
Performance optimization should not stop when the dashboard goes live.
Production monitoring should track:
These metrics help engineering teams identify problems before users report them.
For example, if dashboard response times gradually increase from 300 milliseconds to 2 seconds over several months, that may indicate increasing data volume or inefficient queries.
Monitoring provides the evidence needed to identify the cause.
A production architecture could look like this:

This is a reference architecture, not a universal blueprint.
A smaller application may not need every component.
A large enterprise platform may require additional layers such as message brokers, distributed caching, read replicas, dedicated analytical databases, API gateways, or container orchestration.
Architecture should follow requirements.
Consider a business processing more than 600 orders every day and serving over 43,000 registered customers.
Its ERP contains information about:
Management wants a centralized dashboard showing:
A simplistic implementation could query the ERP directly every time a user opens the dashboard.
That approach may work initially.
But as the number of users, records, and dashboard widgets increases, the ERP can become overloaded.
A better design introduces a controlled integration and application layer.

This architecture separates the dashboard experience from the underlying ERP implementation and provides greater control over performance, security, and future scalability.
This approach was also relevant to a recent Space Stem implementation where an ERP-integrated operations dashboard was developed to provide centralized visibility across high-volume business operations.
A beautiful dashboard cannot compensate for poor data architecture.
This creates security, reliability, and performance problems.
Not every metric requires second-by-second updates.
Aggregate data at the appropriate layer.
Different users often need different levels of visibility.
Use WebSockets or SignalR when the business requirement justifies them.
External APIs fail. Networks fail. Databases become unavailable.
Design for these situations.
Performance needs to be considered from the architecture stage.
A scalable dashboard should typically move through the following stages:

This structured approach reduces the risk of building a dashboard that looks impressive but fails under real-world workloads.
There is a temptation in modern dashboard development to focus on technology:
“Should we use Angular?”
“Should we use SignalR?”
“Should we use Redis?”
“Should we use microservices?”
These are important questions—but they should come later.
The first question should always be:
What business decision are we trying to improve?
Once that is clear, the architecture becomes easier to design.
Technology should support the business requirement rather than dictate it.
A scalable real-time business dashboard is much more than a collection of charts and KPI cards.
It is a complete software system that connects business data with decision-making.
Building one successfully requires careful consideration of:
Technologies such as ASP.NET Core, Angular, SQL Server, APIs, caching, and SignalR provide powerful building blocks for these systems.
But technology alone does not create a successful dashboard.
The strongest solutions begin with business requirements, establish clear data flows, use appropriate real-time strategies, and are engineered to remain reliable as the organization grows.
At Space Stem, we believe the goal of a business dashboard is not to show more data.
It is to help people make better decisions, faster.
That principle should guide every architectural and technology decision that follows.
